
For a better understanding of spectroscopy, we start with the definition of the electromagnetic spectrum, the total of all electromagnetic waves. Typically, waves are designated by their wavelengths or energies respectively and divided into groups.
Electromagnetic waves, in turn, are waves of coupled electric and magnetic fields. Additionally, they can be described as flux of light particles, so-called photons. The combination of both definitions is also called wave-particle duality.
The energy content E of photons is inversely proportional to the wavelength λ of the electromagnetic wave according to following equation:
h is Planck's constant (6.626 × 10⁻³⁴ J∙s) and c is the speed of light (3.00 × 10⁸ m∙s–1).
The following figure shows a diagram of the electromagnetic spectrum.
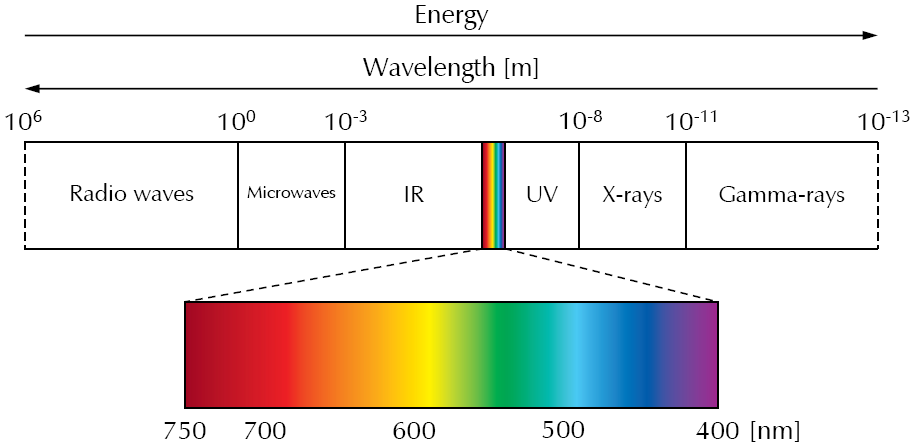
The best-known part of the electromagnetic spectrum is its visible (Vis) range (about 400 nm to 750 nm), which covers only a small section of the electromagnetic spectrum.
With decreasing wavelength and increasing energy, the ultraviolet (UV) is next to visible light. It ranges from about 400 nm to 10 nm. After UV, high-energy radiation follows, which is classified into X-rays and gamma rays.
On the other side of the visible light starts the low-energy radiation. First, the infrared (IR) light comes, which we perceive as heat emitted and reflected by an object. It ranges from about 750 nm to 1 mm. Increasing the wavelength again leads to the region of microwaves which are used in radar technologies as well as the well-known microwave oven. At wavelengths ranging from meters to several kilometers, radio waves are following which are mainly used for telecommunication.
In spectroscopy various types of materials can be investigated and classified by studying their interaction with radiated energy. Depending on the type of radiation and how it interacts with matter, different types of spectroscopy can be distinguished. In this chapter, we will mainly focus on the UV-Vis spectroscopy which includes the Ultraviolet and visible range of the electromagnetic spectrum.
In absorption spectroscopy, a beam of light in the UV-visible range is focused on a sample, and the difference between the incident and transmitted light is measured. Within the sample, electrons can absorb a specific part of the light-energy and transition into a higher energy state. The wavelengths that are absorbed by electrons are related to the energy-level of the molecule. The light that passes through the sample shows significant reduction in intensity at the absorbed wavelengths. These changes can be measured and conclusions can be made about the structure of molecules.
Typically, the wavelength range for UV-Vis spectroscopy is between 200 and 800 nm. The UV region at wavelengths below 200 nm is difficult to handle because air absorbs UV substantially. To perform UV spectroscopy at wavelengths shorter than 200 nm, the whole setup must be kept under vacuum.
NOTE: Many symbols for spectroscopic terms may be the same as for different electrochemical terms. For example, I is current in electrochemistry, while I is intensity in spectroscopy.
The intensity I0 of the incident light drops exponentially in a transparent medium. I depends on the path-length d of the light beam through the sample and the sample's absorption coefficient k.
I = I0 · e–kd
Transmittance (also called transmission) is a term for the amount of light or energy that passes through a sample. Commonly, it is represented in percent (%).
T = I/I0
Absorbance is the negative logarithm of transmittance T and an expression for the decrease of light intensity as the light passes through a sample.
A = –log(I/I0)
Historically, absorbance used to be called extinction. Extinction (also called attenuance), takes also into account the effects of luminescence and light-scattering.
Absorbance is directly proportional to the concentration of the sample. Hence, by measuring changes in absorbance, the slightest changes in the concentration of the sample can be measured.
A = ε · c · d
ε is the molar decadic absorption coefficient and d is the path-length of the light through the sample, given by the dimensions of the cuvette or other sample-holder. A typical path-length in a cuvette is 1 cm.
The blank spectrum is a reference spectrum which is recorded in addition to the actual measurement of the sample. In most cases, only the solvent of the investigated sample is used for a blank spectrum. The blank spectrum is then subtracted from the actual spectrum. Hence the actual measurement records only absorbance of the analyte, and subtraction of the blank removes any distortion caused by the experimental setup.
The cuvette, a sample-holder for liquid samples, contains the sample under investigation. Depending on the experiment, cuvettes have different designs and use different materials. They can be made of plastic (for low price and disposability) up to high-quality quartz for transparency in the UV. The material of the cuvette determines the usable wavelength-range for an experiment.
An important parameter for cuvettes is the path-length d. A typical value for the pathlength is 1 cm. In general, shorter path-lengths of several mm are used when the sample concentration and therefore the absorbance is higher or only a small sample volume is possible. A longer path-length can be used when the sample concentration is low.
Even when no light reaches the detector of the spectrometer, the detector still generates a current flow. This is called dark current. Electrons are generated via thermal activation, causing this effect. It can be reduced when the detector is cooled. The dark spectrum is recorded when no light reaches the detector, i.e., when the shutter of the light source is closed. It is later subtracted from the spectrum of the actual measurement, to remove the effects of thermally-activated electrons.
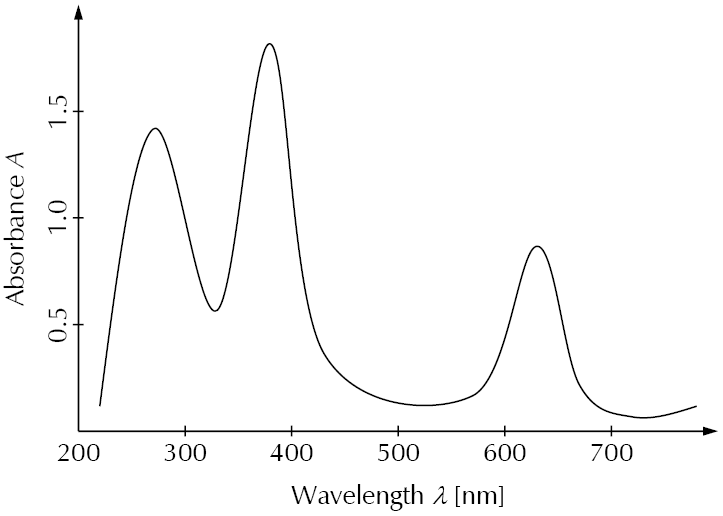
After measuring a sample, the recorded photocurrent is converted into absorbance A or transmittance T which can be plotted versus the wavelength λ. This results in an absorbance or transmittance spectrum respectively.
The following diagram is an example for an absorbance spectrum in the UV-Vis range. Absorbance peaks are at about 270 nm, 380 nm, and 630 nm.
The reciprocal of the wavelength, λ, or the number of waves per unit length along the direction of propagation. The SI unit is m–1, but a commonly used unit is cm–1.
A Raman spectrum graphically shows the measured intensity of scattered light (y-axis) versus each frequency of the light (x-axis). Light intensity is typically shown in raw counts measured by a photodetector. The frequency of the light (also energy) is typically shown as wavenumber ![]() , cm–1.
, cm–1.